Google recently launched three new API’s delivering Solar, Air Quality and Pollen data, all of which sound very intriguing to me…
I’ve talked previously about online services to lookup environmental information, including weather and air quality.
Both datasets very interesting for us here at Trek View – weather can impact what’s in an image (e.g. rain) and air quality has a direct impact on health when outdoors (it is one of the reasons why I’ve also tried measuring it myself too!).
I’ve also previously written about how Google has been capturing air quality in the past.
It now appears they are trying to monetise that data.
At the end of August, Google released a set of new environmental APIs that cover Solar, Air Quality and Pollen data.
In this post, I’m going to technically dive into each of these APIs with the focus of using it alongside street-level imagery…
Side note; sadly none of these are currently available to browse using Google’s API Explorer.
Solar API
A lot of the marketing material for the Solar API is aimed at businesses installing solar panels…
To help accelerate solar adoption and deployment, we launched the Solar API with the goal of helping solar companies give homeowners the information they need to make informed decisions about solar installation.
Source: Google
I was hoping there could be a way to use the API to see if it could be used outside of the context of how much sunshine a roof received. For example, how much of a hike was in shade at a particular time of day. Sadly for us the Solar API is focused rooftop data with the aim of helping to estimate renewable rooftop solar energy potential and savings.
Take a look at some of the data returned in a request for a building;
curl -X POST -d '{
  "location": {
    "latitude": 37.4450,
    "longitude": -122.1390
  }
}' \
-H 'Content-Type: application/json' \
'https://solar.googleapis.com/v1/buildingInsights:findClosest?key=YOUR_API_KEY'
Which returns;
{
  "solarPotential": {
    "maxArrayPanelsCount": 1373,
    "maxArrayAreaMeters2": 2247.3264,
    "maxSunshineHoursPerYear": 1809.6869,
    "carbonOffsetFactorKgPerMwh": 428.9201,
    "wholeRoofStats": {
      "areaMeters2": 2861.0686,
      "sunshineQuantiles": [
        384.4651,
        1385.7468,
        1465.545,
        1523.7301,
        1553.636,
        1589.27,
        1619.2816,
        1640.2871,
        1663.76,
        1750.4572,
        1883.4658
      ],
      "groundAreaMeters2": 2740.45
    },
   "solarPanelConfigs": [
      {
        "panelsCount": 4,
        "yearlyEnergyDcKwh": 1823.9904,
        "roofSegmentSummaries": [
          {
            "pitchDegrees": 12.41514,
            "azimuthDegrees": 179.66463,
            "panelsCount": 4,
            "yearlyEnergyDcKwh": 1823.9905,
            "segmentIndex": 2
          }
        ]
      },
    ],
   "financialAnalyses": [
      {
        "monthlyBill": {
          "currencyCode": "USD",
          "units": "20"
        },
        "panelConfigIndex": -1
      },
      {
        "monthlyBill": {
          "currencyCode": "USD",
          "units": "25"
        },
        "panelConfigIndex": -1
      },
      {
        "monthlyBill": {
          "currencyCode": "USD",
          "units": "30"
        },
        "panelConfigIndex": -1
      },
      {
        "monthlyBill": {
          "currencyCode": "USD",
          "units": "35"
        },
        "panelConfigIndex": 0,
        "financialDetails": {
          "initialAcKwhPerYear": 1550.3918,
          "remainingLifetimeUtilityBill": {
            "currencyCode": "USD",
            "units": "2548"
          },
          "federalIncentive": {
            "currencyCode": "USD",
            "units": "1483"
          },
          "stateIncentive": {
            "currencyCode": "USD"
          },
          "utilityIncentive": {
            "currencyCode": "USD"
          },
          "lifetimeSrecTotal": {
            "currencyCode": "USD"
          },
          "costOfElectricityWithoutSolar": {
            "currencyCode": "USD",
            "units": "10362"
          },
          "netMeteringAllowed": true,
          "solarPercentage": 86.94348,
          "percentageExportedToGrid": 52.350193
        },
        "leasingSavings": {
          "leasesAllowed": true,
          "leasesSupported": true,
          "annualLeasingCost": {
            "currencyCode": "USD",
            "units": "335",
            "nanos": 85540771
          },
          "savings": {
            "savingsYear1": {
              "currencyCode": "USD",
              "units": "-9"
            },
            "savingsYear20": {
              "currencyCode": "USD",
              "units": "1113"
            },
            "presentValueOfSavingsYear20": {
              "currencyCode": "USD",
              "units": "579",
              "nanos": 113281250
            },
            "financiallyViable": true,
            "savingsLifetime": {
              "currencyCode": "USD",
              "units": "1113"
            },
            "presentValueOfSavingsLifetime": {
              "currencyCode": "USD",
              "units": "579",
              "nanos": 113281250
            }
          }
        },
        "cashPurchaseSavings": {
          "outOfPocketCost": {
            "currencyCode": "USD",
            "units": "5704"
          },
          "upfrontCost": {
            "currencyCode": "USD",
            "units": "4221"
          },
          "rebateValue": {
            "currencyCode": "USD",
            "units": "1483",
            "nanos": 40039063
          },
          "paybackYears": 11.5,
          "savings": {
            "savingsYear1": {
              "currencyCode": "USD",
              "units": "326"
            },
            "savingsYear20": {
              "currencyCode": "USD",
              "units": "7815"
            },
            "presentValueOfSavingsYear20": {
              "currencyCode": "USD",
              "units": "1094",
              "nanos": 233276367
            },
            "financiallyViable": true,
            "savingsLifetime": {
              "currencyCode": "USD",
              "units": "7815"
            },
            "presentValueOfSavingsLifetime": {
              "currencyCode": "USD",
              "units": "1094",
              "nanos": 233276367
            }
          }
        },
        "financedPurchaseSavings": {
          "annualLoanPayment": {
            "currencyCode": "USD",
            "units": "335",
            "nanos": 85540771
          },
          "rebateValue": {
            "currencyCode": "USD"
          },
          "loanInterestRate": 0.05,
          "savings": {
            "savingsYear1": {
              "currencyCode": "USD",
              "units": "-9"
            },
            "savingsYear20": {
              "currencyCode": "USD",
              "units": "1113"
            },
            "presentValueOfSavingsYear20": {
              "currencyCode": "USD",
              "units": "579",
              "nanos": 113281250
            },
            "financiallyViable": true,
            "savingsLifetime": {
              "currencyCode": "USD",
              "units": "1113"
            },
            "presentValueOfSavingsLifetime": {
              "currencyCode": "USD",
              "units": "579",
              "nanos": 113281250
            }
          }
        }
      },
    ]
}
Air Quality API
Google’s Air Quality API allows you to request air quality data for a specific location including over 70 air quality indexes (AQIs), pollutants, and health recommendations. It covers over 100 countries with a resolution of 500 x 500 meters.
The API provides endpoints that let you query:
- Current Conditions: Real-time hourly air quality information.
- Hourly History: Air quality history for a specific location, for a given time range, up to a maximum of 30 days.
- Heatmaps: Color coded tiles of various indexes and pollutants.
Let me show you what this data looks like currently for my home city, Bristol, UK (51.454514,-2.587910)
curl -X POST -d '{
  "location": {
    "latitude": 51.454514,
    "longitude": -2.587910
  }
}' \
-H 'Content-Type: application/json' \
'https://airquality.googleapis.com/v1/currentConditions:lookup?key=YOUR_API_KEY'
Which returns
{
  "dateTime": "2023-09-02T07:00:00Z",
  "regionCode": "gb",
  "indexes": [
    {
      "code": "uaqi",
      "displayName": "Universal AQI",
      "aqi": 63,
      "aqiDisplay": "63",
      "color": {
        "red": 0.6862745,
        "green": 0.8745098,
        "blue": 0.12941177
      },
      "category": "Good air quality",
      "dominantPollutant": "pm10"
    }
  ]
}
I can also request much more detailed data using the ExtraComputations object. For example;
curl -X POST -d '{
  "location": {
    "latitude": 51.454514,
    "longitude": -2.587910
  },
  "extra_computations": [
    "HEALTH_RECOMMENDATIONS",
    "DOMINANT_POLLUTANT_CONCENTRATION",
    "POLLUTANT_CONCENTRATION",
    "LOCAL_AQI",
    "POLLUTANT_ADDITIONAL_INFO"
  ],
}' \
-H 'Content-Type: application/json' \
'https://airquality.googleapis.com/v1/currentConditions:lookup?key=YOUR_API_KEY'
Which returns…
{
  "dateTime": "2023-09-02T07:00:00Z",
  "regionCode": "gb",
  "indexes": [
    {
      "code": "uaqi",
      "displayName": "Universal AQI",
      "aqi": 63,
      "aqiDisplay": "63",
      "color": {
        "red": 0.6862745,
        "green": 0.8745098,
        "blue": 0.12941177
      },
      "category": "Good air quality",
      "dominantPollutant": "pm10"
    },
    {
      "code": "gbr_defra",
      "displayName": "DAQI (UK)",
      "aqi": 2,
      "aqiDisplay": "2",
      "color": {
        "red": 0.19215687,
        "green": 1
      },
      "category": "Low air pollution",
      "dominantPollutant": "pm10"
    }
  ],
  "pollutants": [
    {
      "code": "co",
      "displayName": "CO",
      "fullName": "Carbon monoxide",
      "concentration": {
        "value": 0.71,
        "units": "PARTS_PER_BILLION"
      },
      "additionalInfo": {
        "sources": "Typically originates from incomplete combustion of carbon fuels, such as that which occurs in car engines and power plants.",
        "effects": "When inhaled, carbon monoxide can prevent the blood from carrying oxygen. Exposure may cause dizziness, nausea and headaches. Exposure to extreme concentrations can lead to loss of consciousness."
      }
    },
    {
      "code": "no2",
      "displayName": "NO2",
      "fullName": "Nitrogen dioxide",
      "concentration": {
        "value": 42,
        "units": "PARTS_PER_BILLION"
      },
      "additionalInfo": {
        "sources": "Main sources are fuel burning processes, such as those used in industry and transportation.",
        "effects": "Exposure may cause increased bronchial reactivity in patients with asthma, lung function decline in patients with Chronic Obstructive Pulmonary Disease (COPD), and increased risk of respiratory infections, especially in young children."
      }
    },
    {
      "code": "o3",
      "displayName": "O3",
      "fullName": "Ozone",
      "concentration": {
        "value": 9.25,
        "units": "PARTS_PER_BILLION"
      },
      "additionalInfo": {
        "sources": "Ozone is created in a chemical reaction between atmospheric oxygen, nitrogen oxides, carbon monoxide and organic compounds, in the presence of sunlight.",
        "effects": "Ozone can irritate the airways and cause coughing, a burning sensation, wheezing and shortness of breath. Additionally, ozone is one of the major components of photochemical smog."
      }
    },
    {
      "code": "pm10",
      "displayName": "PM10",
      "fullName": "Inhalable particulate matter (\u003c10µm)",
      "concentration": {
        "value": 40.73,
        "units": "MICROGRAMS_PER_CUBIC_METER"
      },
      "additionalInfo": {
        "sources": "Main sources are combustion processes (e.g. indoor heating, wildfires), mechanical processes (e.g. construction, mineral dust, agriculture) and biological particles (e.g. pollen, bacteria, mold).",
        "effects": "Inhalable particles can penetrate into the lungs. Short term exposure can cause irritation of the airways, coughing, and aggravation of heart and lung diseases, expressed as difficulty breathing, heart attacks and even premature death."
      }
    },
    {
      "code": "pm25",
      "displayName": "PM2.5",
      "fullName": "Fine particulate matter (\u003c2.5µm)",
      "concentration": {
        "value": 16.21,
        "units": "MICROGRAMS_PER_CUBIC_METER"
      },
      "additionalInfo": {
        "sources": "Main sources are combustion processes (e.g. power plants, indoor heating, car exhausts, wildfires), mechanical processes (e.g. construction, mineral dust) and biological particles (e.g. bacteria, viruses).",
        "effects": "Fine particles can penetrate into the lungs and bloodstream. Short term exposure can cause irritation of the airways, coughing and aggravation of heart and lung diseases, expressed as difficulty breathing, heart attacks and even premature death."
      }
    },
    {
      "code": "so2",
      "displayName": "SO2",
      "fullName": "Sulfur dioxide",
      "concentration": {
        "value": 0.21,
        "units": "PARTS_PER_BILLION"
      },
      "additionalInfo": {
        "sources": "Main sources are burning processes of sulfur-containing fuel in industry, transportation and power plants.",
        "effects": "Exposure causes irritation of the respiratory tract, coughing and generates local inflammatory reactions. These in turn, may cause aggravation of lung diseases, even with short term exposure."
      }
    }
  ],
  "healthRecommendations": {
    "generalPopulation": "With this level of air quality, you have no limitations. Enjoy the outdoors!",
    "elderly": "If you start to feel respiratory discomfort such as coughing or breathing difficulties, consider reducing the intensity of your outdoor activities. Try to limit the time you spend near busy roads, construction sites, open fires and other sources of smoke.",
    "lungDiseasePopulation": "If you start to feel respiratory discomfort such as coughing or breathing difficulties, consider reducing the intensity of your outdoor activities. Try to limit the time you spend near busy roads, industrial emission stacks, open fires and other sources of smoke.",
    "heartDiseasePopulation": "If you start to feel respiratory discomfort such as coughing or breathing difficulties, consider reducing the intensity of your outdoor activities. Try to limit the time you spend near busy roads, construction sites, industrial emission stacks, open fires and other sources of smoke.",
    "athletes": "If you start to feel respiratory discomfort such as coughing or breathing difficulties, consider reducing the intensity of your outdoor activities. Try to limit the time you spend near busy roads, construction sites, industrial emission stacks, open fires and other sources of smoke.",
    "pregnantWomen": "To keep you and your baby healthy, consider reducing the intensity of your outdoor activities. Try to limit the time you spend near busy roads, construction sites, open fires and other sources of smoke.",
    "children": "If you start to feel respiratory discomfort such as coughing or breathing difficulties, consider reducing the intensity of your outdoor activities. Try to limit the time you spend near busy roads, construction sites, open fires and other sources of smoke."
  }
}
The LOCAL_AQI option returns the local AQI measurement, in this case from the DEFRA (gbr_defra) in addition to the universal air quality index. Using DOMINANT_POLLUTANT_CONCENTRATION also includes the highest pollutant in the air at the time of the measurement, currently pm10.
POLLUTANT_CONCENTRATION, and POLLUTANT_ADDITIONAL_INFO returns details of all the pollutants monitored by this station. In Bristol these are, CO, NO2, O3, PM10, PM25 and SO2.
Finally, HEALTH_RECOMMENDATIONS provides health recommendations for different sections of society (e.g. pregnantWomen). Luckily for us here in Bristol, conditions are good so the recommendations are fairly generic.
This data is very useful in comparing to our library of historic images. Data is reported every hour, allowing me to lookup the air quality for all my recorded outdoor activities.
Pollen API
I couldn’t find any documentation about the Pollen API, except for the marketing page, nor could I enable the Pollen API in the Google Cloud Console. My assumption would be that it’s still in some sort of private state.
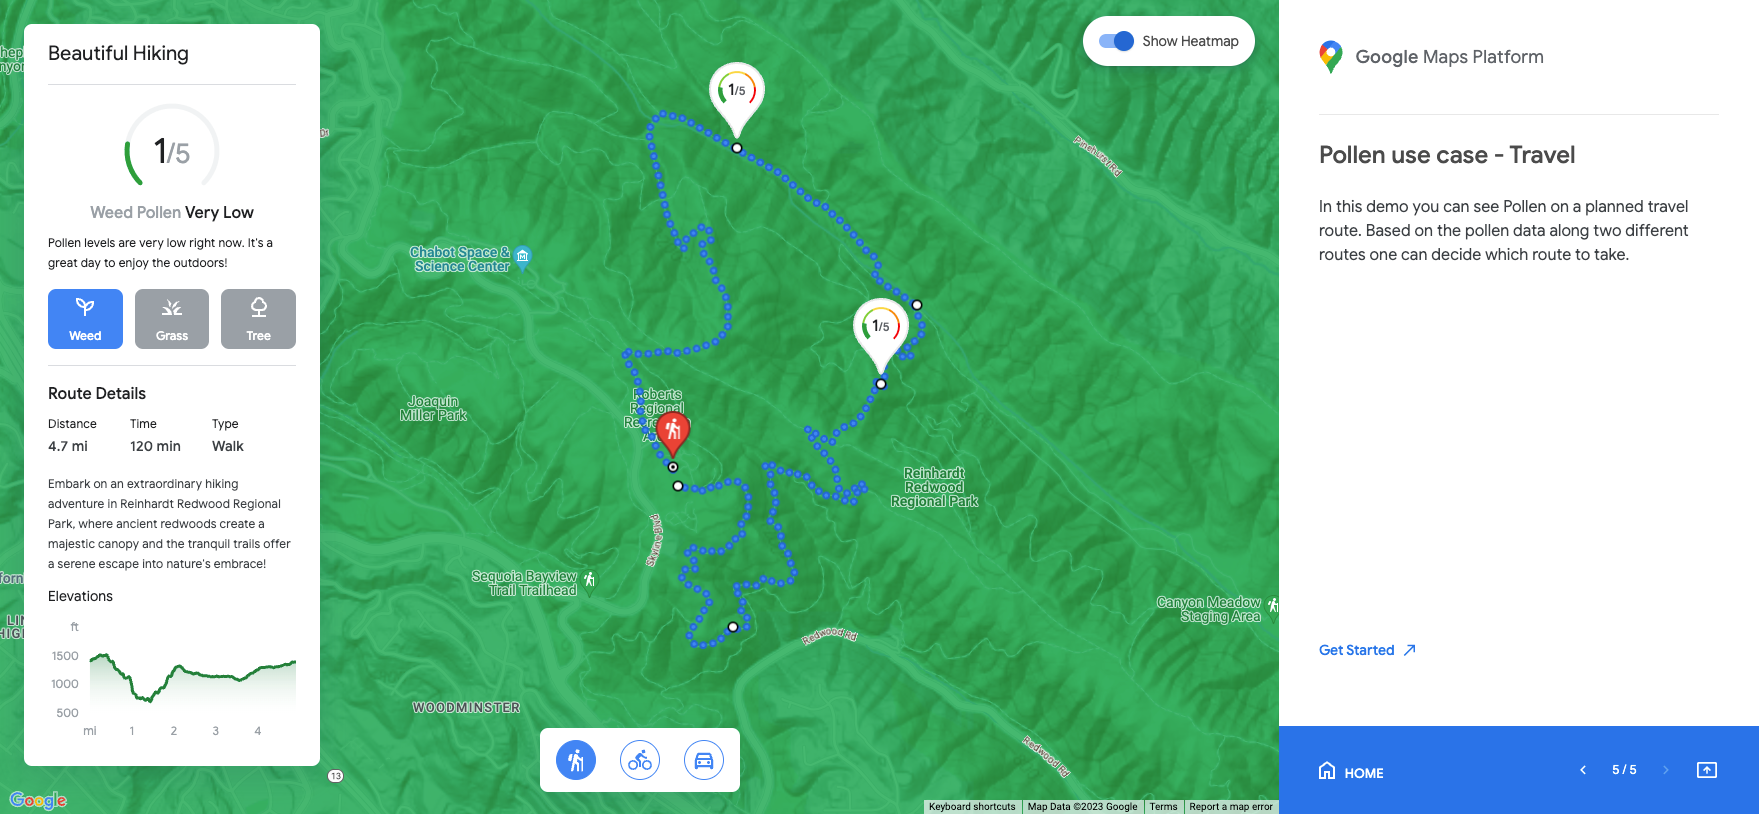
That said, there is an interactive web based explorer available here.
One of the use-cases shown in the demo of this is perfect for me – seeing current and historical pollen levels for a hike.
Not only that, three different types of pollen are recorded tree, grass, and weed.

Unfortunately it is unclear as to what resolution the data is reported, or how often measurements are taken from the API. Fingers crossed that I will be able to provide an update in a few weeks when Google make the Pollen API generally available.
We're building a Street View alternative for explorers
If you'd like to be the first to receive monthly updates about the project, subscribe to our newsletter...


