Our initial thoughts after testing the AtmoTube Pro.
My AtmoTube Pro arrived recently. It didn’t take long before I started testing it out.
This post is a short review of what I’ve liked and disliked so far.
Unboxing
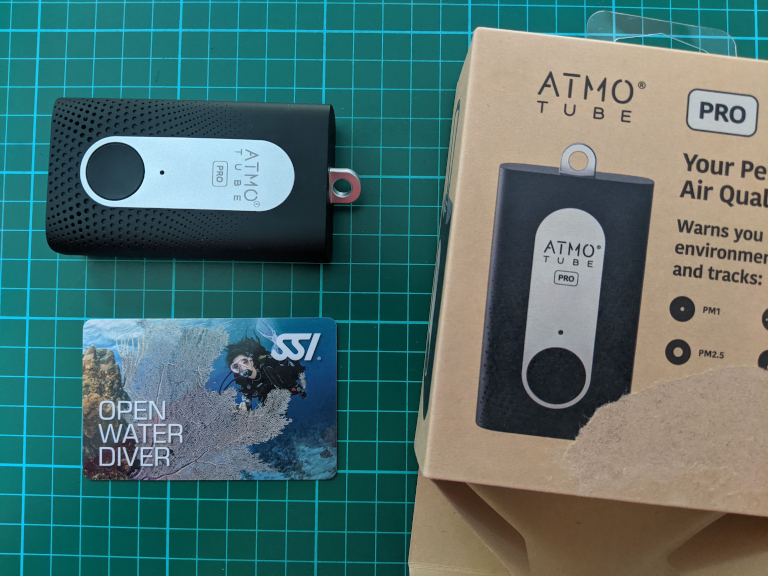
The device itself is about the length and width of a credit card, and has a depth of two modern smartphones (exact measurements: 86 x 50 x 22 mm).
Inside the box is:
- AtmoTube Pro
- USB-A to USB-C wire (for charging)
- Caribiner (to attach the device to something)
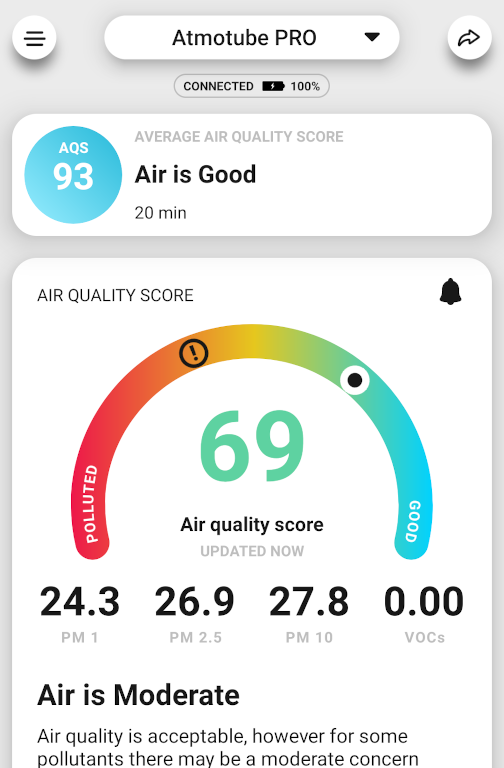
You’ll need to download the accompanying AtmoTube mobile app to get it working:
Unlike some devices, the AtmoTube Pro paired (over Bluetooth) with my phone seamlessly.
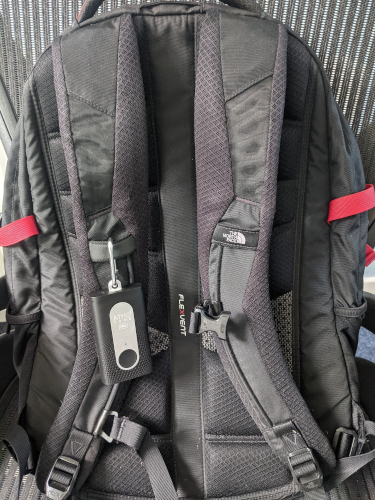
The included caribiner also works perfectly to attach the device to a bag.
Setup
It’s important to note that I’m reviewing the AtmoTube Pro as a data collection device.
The AtmoTube Pro has a number of features I’m not interested in for the purpose of mounting the monitor to a Trek Pack.
The mobile app is nicely designed, and generally quite intuitive when trying to figure something out.
I wanted to first set the data capture interval to be as granular as possible.
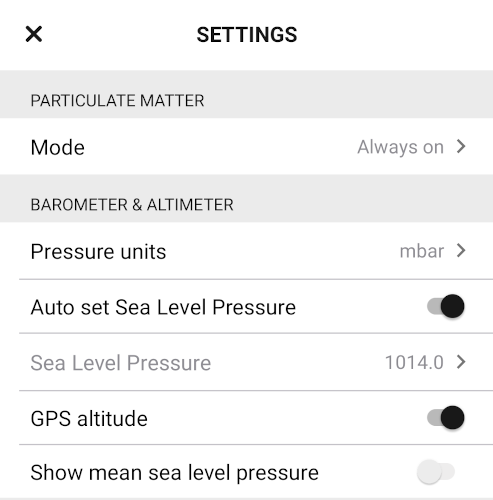
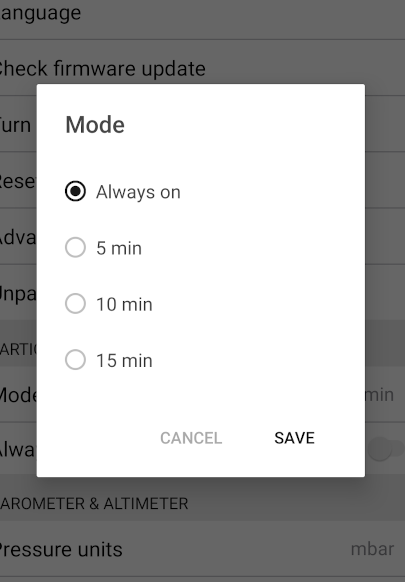
Under setting you can adjust the PM (Particulate Matter) sensor measurement interval to one of 4 defined settings:
- Always on
- 5 minutes
- 10 minutes
- 15 minutes
For the VOC (Volatile Organic Compounds) sensor, I was unable to find a setting that allowed me to change the interval.
Regardless, always on results in a measurement from all sensors being recorded every 1 minute.
Such a large gap between recorded measurements is not ideal, we’d prefer a resolution of at least ten seconds, but I assume this is a trade-off for battery life on a portable sensor like this.
Results
The holes in the casing are on the front so I made sure these were facing forward to capture the airflow. I’m not sure if this is recommended, especially when traveling fairly quickly on a bicycle as I did for this test.
Living close to a number of airports, air quality is always at the back of my mind as planes fly over so I decided to take a quick bike ride with my AtmoTube Pro to capture some measurements.
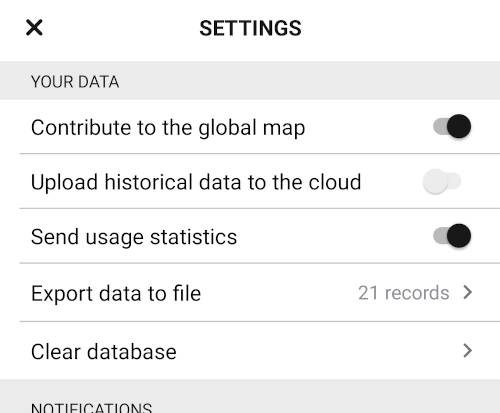
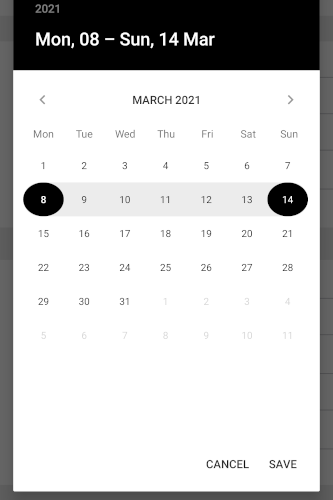
To export the logged data from the app, you navigate to the settings page and select the date range you want the data for.
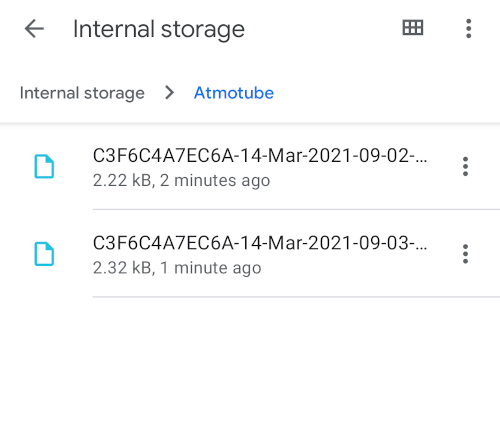
Once you’ve selected a date, the app will save a .csv file to your phones internal storage. On Android devices to get to the file go to: Files > Internal Storage > AtmoTube.
Open the .csv on your computer and you’ll find the following values recorded:
DateVOC, ppmAQSTemperature, °FHumidity, %Pressure, mbarPM1, ug/m³PM2.5, ug/m³PM10, ug/m³LatitudeLongitude
Take a look at the first post in this series for a deeper explanation on each value.
Here’s the resulting capture from my morning bike ride.
The above map shows the Air Quality Score (AQS) by position.
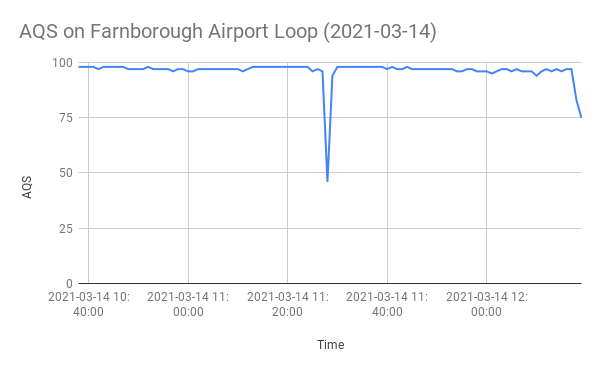
The mean average AQS for my ride was 96.22, which is very good (the highest score possible being 100).
Overall the AtmoTube Pro reported the air quality as I would expect. For example, during the middle of the journey I rode through thick, visible smoke in the air coming from a bonfire about 20 metres away. At this point you can see the AQS dip to 46.
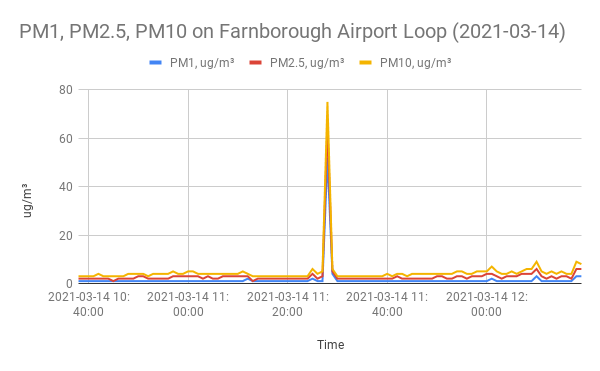
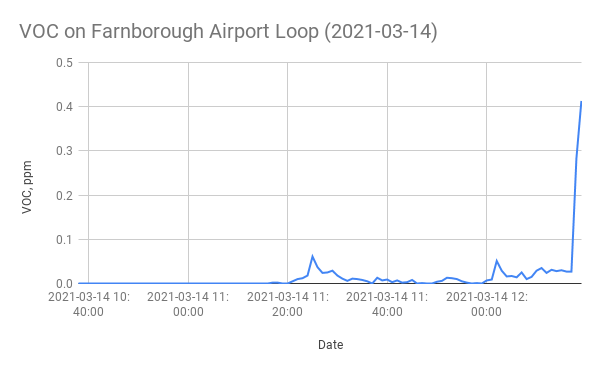
Looking at the two graphs above you can see the fire caused a massive spike in PM1, PM2.5 and PM10 pollution (having a slight effect on VOC in the air).
When I arrived home you can see VOC spike which I believe is down to household products that had been used to clean the house earlier in the day.
Overtime I’ve been running the AtmoTube Pro indoors and the amount of VOC’s measured isn’t quite as high, but still noticeably higher than measurements taken in my garden.
Things I didn’t like
The most obvious flaw is that GPS receiver does not appear to be particularly good (see my post, GPS 101, for reasons why this might be the case).
In many instances, the latitude and longitude reported is significantly erroneous. I’ve drawn an outline of my route using the polygon on the map above. Compare that line to the plotted points and you can see many are 100’s of metres off-line.
The receiver also seems to struggle to stay locked to satellites in places with mild tree cover. I was moving the whole time on this journey, yet for 5 minutes the device reported that I was in the exact same place (between 11:54:00 and 11:59:00, latitude=51.2372807 and longitude=-0.8153424).
For us this is not a deal breaker. If you use a reliable GPS tracker (like your 360 camera) to record your journey, you can match the time of each measurement on each device to overwrite the incorrect GPS points reported in the AtmoTube Pro output.
I also noticed that altitude was not reported in the output file, despite claims on the box and instructions that this was captured. Using an external tracker again or a Digital Elevation Model will solve this problem.
We're building a Street View alternative for explorers
If you'd like to be the first to receive monthly updates about the project, subscribe to our newsletter...
