We continue to build out our Data Bike and are now trying to establish a global standard to measure cycle trail quality.
In the previous post I considered some apps that can be used to record raw data from your phones IMU.

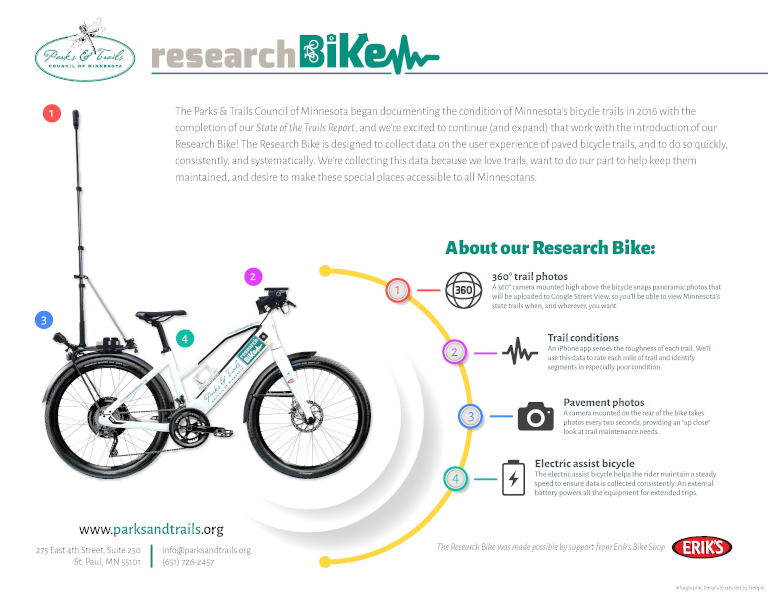
The Parks & Trails Council of Minnesota operate a Research Bike that documents the state of their cycling trails. In addition to their interactive maps, you can view their previous State of the Trails reports here.
These reports contain a Trail Roughness Index (TRI), an aggregated score created by the Parks & Trails Council of Minnesota:
Trail Roughness Index is measured by riding a trail with a device called an accelerometer mounted on the bike’s handle bars. When the bicyclist hits a crack or bump in the trail, the accelerometer measures the force of the jolt felt by the bicyclist. The TRI is a statistical summary of the accelerometer data that indicates the roughness of the ride. Low TRI scores indicate trails in excellent condition (TRI < 30) and high TRI scores indicate trails in very poor condition (TRI > 75).
This posts details my attempt at creating a Trail Quality Index using a similar approach.
Orientation
I strongly recommend reading about Accelerometers in this post if you’re new to their functionality.

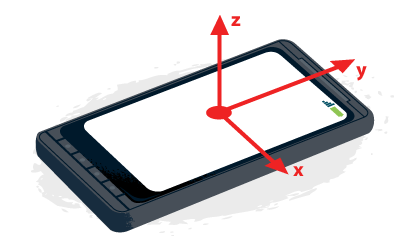
An accelerometer measures change in velocity across 3 planes; x, y, and z. The diagram shows how these planes are orientated in relation to your phone or tablet. Orientation is uniform across devices, so all apps can read the data in an expected standard.
The orientation of the phone has an impact on the measurements recorded. The main data point we’re looking to identify is the vertical (up and down) motion caused by uneven surface trail (assuming the phone is laid flat).
If you were to lay the phone on its side, we would be measuring change in velocity along the x axis to measure change in vertical acceleration whilst bumping up and down. If the phone was standing up-right this measurement would be taken from the y axis.
A more complex calculation would consider change across all axis against the orientation of the phone (captured by the gyroscope). However, because our capture conditions are somewhat controlled on fairly level trails and such a calculation involves a certain level of mathematical complexity, I’m keeping it simple for now.
To ensure accuracy with this approach requires the phone to be mounted in a secure and snug mount as flat as possible to the ground because I’ll be measuring change in velocity exclusively along the z axis.
Choosing what data to measure
To capture data I used the Physics Toolbox Sensor Suite Pro app on my phone. Any app that can measure raw accelerometer data will work using my approach.
The linear accelerometer measures acceleration in a straight line in three different dimensions. Linear acceleration changes whenever the mobile device speeds up, slows down, or changes direction. When the mobile device is at rest with respect to the surface of the earth, it reads acceleration values of 0, 0, 0.
The linear accelerometer measures acceleration (m/s^2) and g-force (G) along the three planes; x, y, z.
axayaz
The concept of G’s, or “G-forces,” refers to multiples of the acceleration due to gravity and the concept applies to acceleration in any direction, not just toward the Earth. 1G is the acceleration we feel due to the force of gravity.
For example, let’s say you accelerate from 0-100km/h in 2.3 seconds. 100kph is 28m/s, 28 / 2.3 = 12m/s^2, 12 / 9.8 = 1.2G (y).
G-force is often used express the forces on the human body during acceleration, and is a perfect measure of change in force on the bike and its rider across the z axis as they travel along the trail.
Capturing the data
Controlling for speed is important to ensure TRI scores are comparable across data samples.
Imagine traveling fast on a bike, you tend to fly over the smaller bumps in the road. Following a gravel path more slowly and it’s likely you’ll feel the small undulations in the rocky surface in much greater detail.
The inverse is also true. Hit a large object quickly, like a curb, and you’ll feel it much more than hopping up it slowly.
Similarly, it is important weight, riding style and bike remain controlled between each capture to ensure consistency.
I setup the app to record data at 100Hz (100 measurements every second), which is a nice trade-off between measurement interval and battery life for a short ride (as more measurements result in shorter battery life due to the extra powered required).
Here’s a sample I recorded riding a short section of gravel path.
Interpreting the data
Below are the aggregated results for a 20 second stretch of the gravel path.
| time | gFz (moving ave)*100 | Latitude (end of segment) | Longitude (end of segment) | Speed (m/s) (moving ave) |
|---|---|---|---|---|
| 09:47:06:023 | 69.36168421 | 51.31537657 | -0.79423086 | 1.084736871 |
| 09:47:07:011 | 65.15789474 | 51.31539302 | -0.79422745 | 0.9967368506 |
| 09:47:08:001 | 65.72189474 | 51.31538571 | -0.79421406 | 1.324210468 |
| 09:47:09:006 | 66.63884211 | 51.3154014 | -0.79424119 | 1.763789463 |
| 09:47:10:004 | 70.07926316 | 51.3154014 | -0.79424119 | 2.116210417 |
| 09:47:10:988 | 67.41242105 | 51.31541991 | -0.79426345 | 2.470526319 |
| 09:47:12:019 | 70.49505263 | 51.31547389 | -0.79424044 | 2.552842052 |
| 09:47:13:000 | 64.35273684 | 51.31550911 | -0.79422871 | 2.399789572 |
| 09:47:14:007 | 68.28021053 | 51.31550911 | -0.79422871 | 2.70000005 |
| 09:47:15:015 | 65.372 | 51.31556383 | -0.79420798 | 2.91863165 |
| 09:47:16:012 | 66.15305263 | 51.31558425 | -0.79417606 | 2.6576843 |
| 09:47:18:003 | 64.894 | 51.31562078 | -0.7941161 | 2.696736893 |
| 09:47:19:000 | 66.80010526 | 51.31563464 | -0.79408076 | 2.406000095 |
| 09:47:20:005 | 66.52894737 | 51.31563464 | -0.79408076 | 2.76999998 |
| 09:47:21:020 | 66.67326316 | 51.31565847 | -0.79399486 | 2.911473779 |
| 09:47:22:000 | 67.89063158 | 51.31567242 | -0.79394735 | 3.233157914 |
| 09:47:23:024 | 67.19957895 | 51.31568593 | -0.7938951 | 3.543473651 |
| 09:47:24:013 | 68.28747368 | 51.31570096 | -0.79384037 | 3.858526215 |
| 09:47:25:003 | 67.18757895 | 51.31571787 | -0.79378323 | 4.119684108 |
| 09:47:26:008 | 69.03978947 | 51.31573583 | -0.79372659 | 4.110315917 |
| 09:47:27:026 | 69.66178947 | 51.31574883 | -0.79366774 | 4.141263027 |
| 09:47:28:006 | 76.89389474 | 51.31576046 | -0.79361817 | 4.149684047 |
| 09:47:29:021 | 74.40768421 | 51.3157672 | -0.79358403 | 3.134526339 |
The aggregated stats include a calculated moving average by taking a mean of the last 10 measurements (equal to 0.1 second) for gFz and speed (m/s). The co-ordinates shown above show the final location of the 10 measurement average.
For G-Force (z) I multiplied by 100 for scale, so I could use a comparative scale to The Parks & Trails Council of Minnesota:
- (gFz * 100) < 30 = Excellent
- (gFz * 100) 30 - 45 = Good
- (gFz * 100) 45 - 60 = Fair
- (gFz * 100) 60 - 75 = Poor
- (gFz * 100) > 75 = Very Poor
Finally, I took the value closest to every whole second for a more manageable dataset (1 measurement every second vs. 100 raw measurements). This is what you see above.
All measurements from this capture fall into the Poor category which is expected given the measurements above were taken from a woodland gravel path.
When measuring on smooth roads I was getting readings between 15 - 25 ave gFz * 100. Subsequence rides have generally produced results in line with expectations, even where cycling speed varies by +/- 10km/h.
Limitations
The TRI only measures the smoothness of the path taken by the bicycle, and as such likely underestimates the overall condition of trails with easily avoidable bumps and cracks (i.e. those forming along pavement edges or longitudinally down the center).
Similarly, there are an almost infinite number of paths a cyclists could take. These measurements only consider one unique path. Ideally a trail would be measured multiple times to account for different lines taken by the bicycle, errors associated with speed adjustments, and random noise associated with vibrations in the bicycle frame and rider movements.
TRI is a summary statistic for a given segment of trail. Over the course of a kilometer, a trail may be in excellent condition for one stretch and in poor condition for another.
In this case I choose sections of about 2 metres over a timeline of 1 second (which is very granular). For a large trail network, presenting this data will take more processing to prove valuable. Riders are going to want details of the best and worst parts of the trail but are not going to want to sift through data at 2 metre intervals.
For a cheap and fairly reliable way to measure trail quality this methodology is surprisingly accurate. However, rolling this out on a global scale is a different story.
A global standard
Making a solution affordable for anyone to capture measurements is critical, though a standard level of accuracy is just as important.
It’s clear the variables of using a phones’ accelerometer to capture measurements – the phone, its holder, the bicycle, its rider, their riding style – make it very difficult to normalise measurements.
Therefore, I can’t see any way a phone is a viable in pursuit of a global TRI. But a camera, already fitted to the Data Bike, might offer a solution.
A quick search of the internet returns lots of research, for example the IEEE Global Road Damage Detection Challenge 2020.
If it’s possible to use the imagery captured by the Data Bike to measure cycle path quality, the cameras might prove even more valuable (and lower the amount of kit needed for the Data Bike).
If you have any experience in this area, I’d love to hear from you.
We're building a Street View alternative for explorers
If you'd like to be the first to receive monthly updates about the project, subscribe to our newsletter...


