A Digital Elevation Model (DEM) is a 3D computer graphics representation of elevation data to represent terrain.
There are plenty of devices that can approximate your elevation (or depression) compared to sea level.
A 3 satellite fix gives your position on the face of the earth at sea level, whether or not you are at sea level.
A 4 satellite fix gives your altitude, where you are in relation to sea level.
You can usually see 6 or more satellites above the horizon, so sufficient GPS fixes are usually easy to achieve. Generally the more satellites in direct line-of-sight to the receiver, the better the measurements reported.
In cases where only 4 satellites are fixed, perhaps due to high surrounding buildings, altitude can often be erroneous, despite horizontal position being fairly accurate.
For very precise requirements, GPS is not very reliable for elevation because a satellite must be directly overhead to calculate the measurement to within a high degree of accuracy.
But I won’t start getting too geeky…
My point being; sometimes you have geographic data that consists only of accurate latitudes and longitudes, but you want to know the accurate altitude of these point as well — because, for example, you want to colourise points by height above sea level, or draw a profile of a track.
Digital Elevation Models (DEM’s)
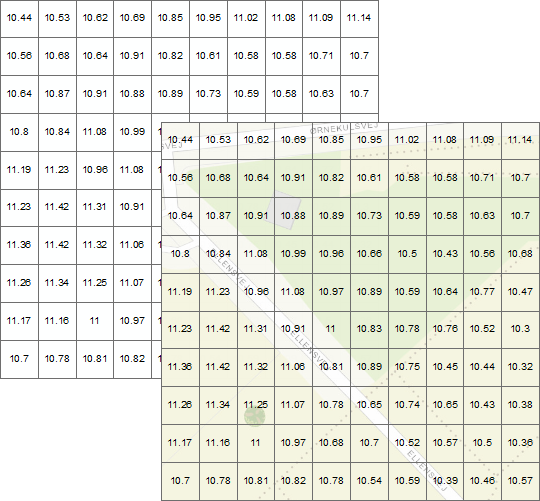
A DEM data set defines points or grid cells with three values, or coordinates, – x, y and z - where x and y are traditional latitude-longitude location references, and z represents the elevation or height of the point or cell.
Map surfaces are usually modeled with raster datasets. A raster is a matrix of cells, also called pixels, organized in rows and columns and covering some part of the world (or even the whole world). Each cell in the matrix represents a square unit of area and contains a numeric value that is a measurement or estimate for that location.

The size (area) of a cell varies depending on the Digital Elevation Model and how it was created. For example, where LiDaR has been used to capture topology, you might have very high resolution (small area) cells, perhaps as small as a few centimeters square.
Generally the scale of the model impacts its cell resolution.
A survey of a building site just 100m2 might have very high resolution cells (small area). A global Digital Elevation Model that includes the highest mountains and deepest sea trenches will usually have a much lower cell resolution (bigger area) in these locations.

Take a look at this DEM of Mount Everest.
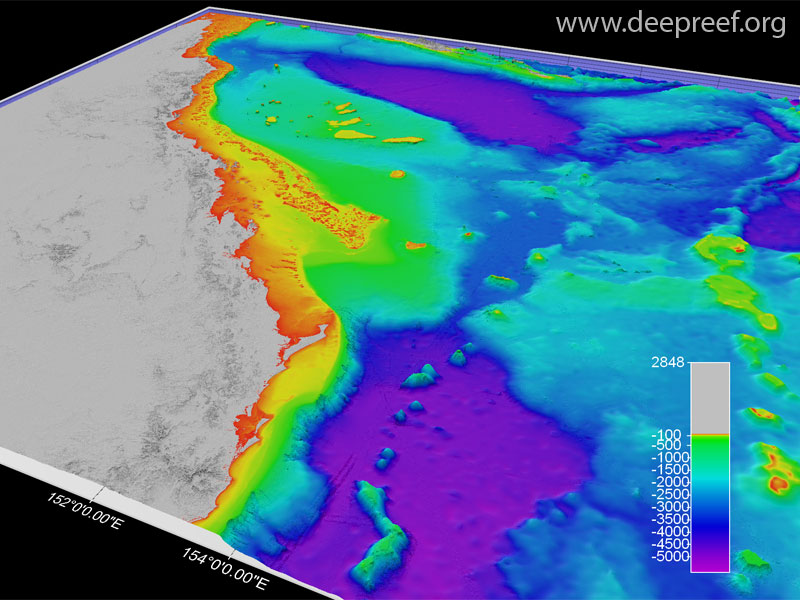
Or this DEM of the Great Barrier Reef.
Essentially, with a global DEM, I can take a latitude and longitude and perform a lookup to get a fairly accurate approximation of altitude.
Global DEM’s
There are a good number of Global DEM’s available online.
Perhaps the most widely used is Google’s Elevation API. It’s also perhaps one of the most comprehensive Global DEM’s given the coverage of Google Maps data. The downside, it can be expensive for large-scale use (at time of writing $5USD per 1,000 lookups).
The Mapbox Tilequery API works in a similar way, returning the elevation for a given point (latitude and longitude). Mapbox has a generous free tier, but this is also a paid service for heavy users.
Open-Elevation is a free and open-source alternative to the above offerings. You can use it to host your own global DEM database and API, or alternatively use their free public API.
A few more options are listed here too.
If none of these work for you, there are many more alternatives to discover from a quick search for “Global DEM”.
We're building a Street View alternative for explorers
If you'd like to be the first to receive monthly updates about the project, subscribe to our newsletter...


